It is very short article about post-processing in FlowVision. Just main idea which allow you quickly build several ColoredFD pictures.
Layers and Characteristics
It is possible to look on some integral characteristics or visualize distribution of some variable in computational space.
Characteristics – it is way to calculate some integral values which based on some variable. For example with characteristic is possible to calculate Flow rate, Integral forces and torques, averaged value of Pressure, Velocity, Temperature, etc. in volume or over surface.
Layers – it is distribution of vectors in volume or over surface, color contours over surfaces and in planes, streamlines and other visualizations of local values of different variables.
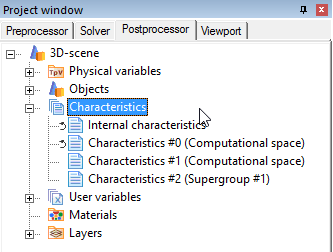
How to determine Characteristics or Layers
To create Characteristics or Layers it is necessary to make three steps:
- Specify HOW you want to visualize your variable (vectors, streamlines, integral characteristics)
- Specify WHERE you want to visualize your variable (in volume of some object or over surface of other object)
- Specify WHAT variable you want to visualize
How you want to visualize
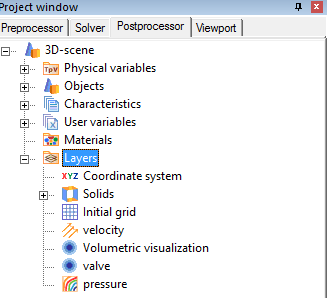
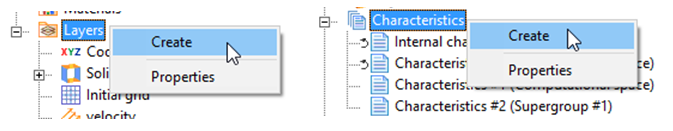
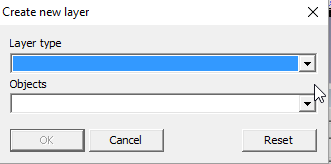
Just create Characteristic or Layer (right click over Characteristic folder or Layers folder in Postprocessor tree)
For layers in next window is necessary to choose kind of layer:

Where you want to visualize
When you create Layers and Characteristics it is necessary to choose object which will used for calculating of visualization data.
You may want to color with pressure only part of your model or you may want to calculate averaged pressure only over part of model.
You can use next objects for visualization:
- Any imported objects which can be prepared in CAD
- Boundary conditions or combinations of boundary conditions (supergroups)
- Built-in standard objects: in FlowVision is possible to create geometrical primitives, like Platonic solids, sphere, box, cone, cylinder, plane. More about standard objects: https://flowvision.ru/webhelp/fven_30905/objects.htm
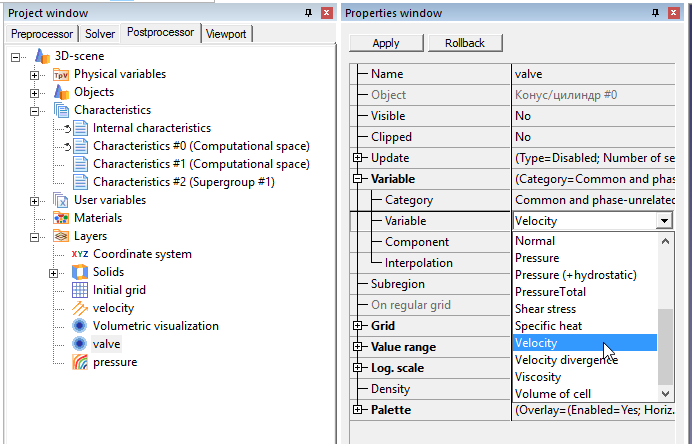
What variable you want to visualize
When you created layer or characteristic, choose it in project tree. In properties window you can make many thin customizations of layer. Here also is necessary to specify Variable which will be used for visualization.
What are features of FlowVision’s visualization?
There are several features which is important to know:
- You can look on results during simulation. You do not need to wait when simulation will be finished
- You can look on results even if you run simulation on supercomputer on many computational nodes. It is possible, because data for visualization will be prepared by Solver and sent to client application (Pre-postprocessor or viewer)
- If client connected to Solver, Solver will prepare data each time step. Preparing of visualization data and sending it through network require some CPU’s time. That is why important to disconnect client from Solver when you do not need look on results online, but need to finish simulation as soon as possible.
- When you solver very large tasks (with many millions of cells), you will have very large count of saved data (may be hundreds of gigabytes). It is possible that you will not have possibility to download it or load it on your personal computer for visualization (because not enough of RAM). But you can create necessary layers and export to fvvis file only data which is necessary only for building these layers. Such files less then whole results of simulation. https://flowvision.ru/webhelp/fven_30905/index.html?element_avtosohranenie_sloyov.htm
- For receiving data for visualization is necessary to connect to Solver or load FVVIS files.
- If you have saved results with history, you can export data for visualization for new layers. It means that you do not need start simulation from scratch if you want to visualize something new which was not created before simulation.